

LinkedIn metrics are numerical indicators that measure how effectively your content and profile engage your professional network. The most impactful ones are engagement rate, comment volume, follower growth rate, click-through rate, and saves. Raw impression counts tell you almost nothing on their own. The professionals who grow fastest on LinkedIn are the ones who track the right numbers and act on them systematically.
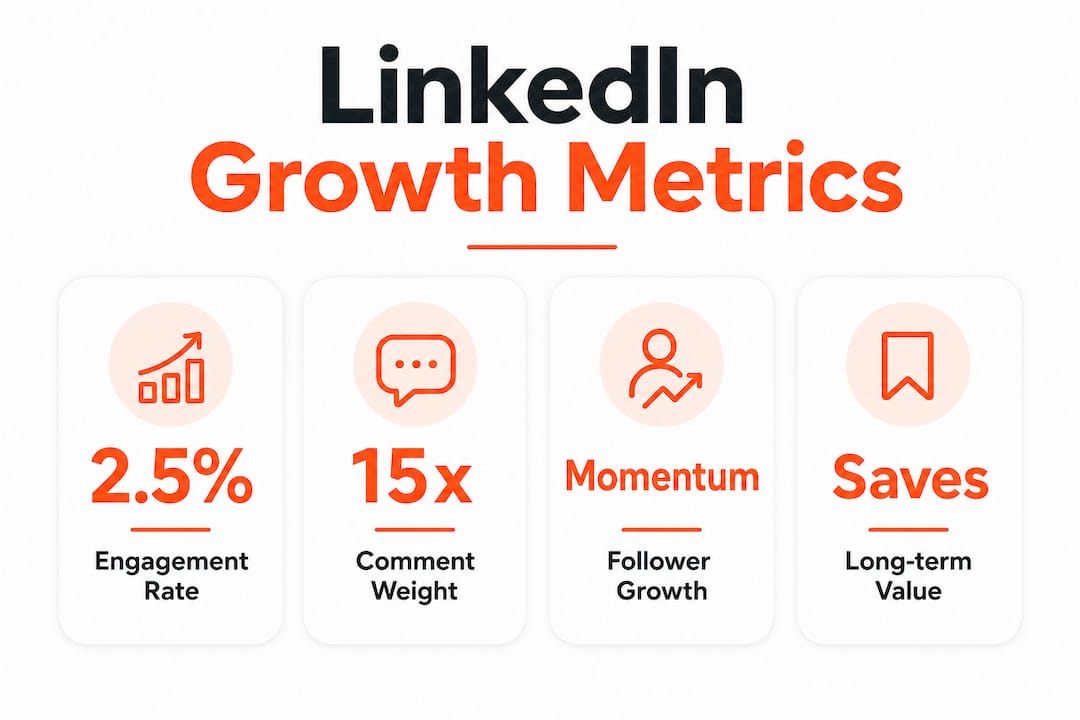
The median LinkedIn engagement rate is 2.50%, with accounts in the 1,000–5,000 follower range performing best at 2.68%. That benchmark gives you a real target to measure against, not a vague aspiration. If your rate sits below 2%, your content is reaching people but not resonating. That gap is fixable once you know which performance indicators to watch.
What are the essential LinkedIn metrics and how to calculate them?
Engagement rate is the single most useful LinkedIn analytics figure you can track. The formula is: (Reactions + Comments + Reposts + Clicks) ÷ Impressions × 100. A result above 2.5% means your content is connecting with your audience. Below that, something in your hook, format, or topic needs to change.

Comments carry far more weight than most users realize. Comments carry about 15 times more algorithmic weight than likes on LinkedIn. That means one genuine comment does more for your post's distribution than 15 people clicking the like button. Prioritizing content that sparks conversation is not just good practice. It is the most direct path to wider reach.
Follower growth rate measures momentum, not size. Calculate it by dividing new followers gained in a period by your total followers at the start, then multiplying by 100. A steadily rising rate signals that your content is attracting the right people. A flat or declining rate, even with high impressions, means your content is not compelling enough to earn a follow.
Saves indicate long-term value and reference quality. When someone saves your post, they plan to return to it. That behavior signals utility, not just entertainment. Image posts generate 65.3% of saves, followed by documents, videos, text posts, and articles. If you want saves, lead with a visual that delivers a framework or checklist.
Dwell time is an invisible but highly important metric influencing LinkedIn's distribution algorithm. LinkedIn measures how long users pause on your post before scrolling past. A post that holds attention for several seconds gets pushed to more feeds, even if it collects fewer reactions. Writing longer, structured posts or using carousels that require multiple swipes naturally increases dwell time.
| Metric | What it measures | How to calculate |
|---|---|---|
| Engagement rate | Overall content resonance | (Reactions + Comments + Reposts + Clicks) ÷ Impressions × 100 |
| Comment rate | Conversation quality | Comments ÷ Impressions × 100 |
| Follower growth rate | Audience momentum | New followers ÷ Starting followers × 100 |
| Click-through rate | Link interest | Clicks ÷ Impressions × 100 |
| Save rate | Content utility | Saves ÷ Impressions × 100 |
Pro Tip: Check your LinkedIn click-through rate separately from your overall engagement rate. A post can have strong engagement but weak clicks, which tells you the content is entertaining but your call to action is not landing.
How to interpret LinkedIn metrics to improve content and engagement
Raw impressions and follower counts are misleading as standalone figures. A post that reaches 10,000 people but generates 20 reactions has a 0.2% engagement rate. That is not a win. Meaningful ROI metrics include engagement rate, quality engagement, click-through rate, follower quality, leads, and conversions. Impressions without engagement mean your content is being skipped.
The quality of comments matters as much as the count. Long comments over 15 words are twice as impactful as short reactions for engagement and algorithm favorability. A post that generates five thoughtful, multi-sentence replies outperforms one with fifty one-word responses. When you write content, ask yourself: "Does this post invite a real answer?" If not, rewrite the closing line.
A weekly review routine is the most underrated habit in LinkedIn analytics. A 15-minute weekly review focused on your top and bottom performing posts helps you identify patterns and test changes systematically. Set aside time every Monday morning. Pull your last seven days of data, note which posts beat your 2.5% benchmark, and identify one variable that differed in those posts.
Running simple tests accelerates your learning. Change one variable per week: the hook style, the topic category, the post format, or the call to action. Never change two things at once. If you switch from a question hook to a story hook and also change your topic, you cannot tell which change moved the needle. Testing one variable per period improves repeatability and reduces conclusions based on viral anomalies.
Tracking trends over time beats reacting to single posts. One viral post does not mean your strategy works. One weak post does not mean it is broken. Look at your rolling four-week average engagement rate. If that number is rising, your content decisions are working. If it is flat or falling, something needs to change.
Pro Tip: Link each metric to a specific decision. Low save rates with high engagement indicate entertaining but not actionable content. That combination tells you to shift toward utility posts: frameworks, checklists, and step-by-step guides.
Best practices and tools for tracking and maximizing LinkedIn metrics
LinkedIn's native analytics dashboard gives you impression counts, engagement breakdowns, follower demographics, and profile view data. It is free and sufficient for most users who post fewer than five times per week. The limitation is that native analytics does not store historical data beyond 365 days and offers limited post-by-post comparison tools. Third-party tools fill that gap by archiving data and surfacing trends across longer periods.
LinkedIn's Social Selling Index measures your effective use of the platform across four dimensions: professional branding, finding the right people, engaging with insights, and building relationships. The score runs from 0 to 100. A score above 70 correlates with stronger organic reach. Check yours monthly as a secondary health indicator alongside your engagement rate.
Setting benchmarks based on your own follower size matters more than chasing industry averages. The engagement rate for accounts with over 100,000 followers drops to 1.53%, while smaller accounts in the 1,000–5,000 range average 2.68%. Comparing your 3,000-follower account to a thought leader with 200,000 followers produces a false picture of your performance.
- Review your analytics every Monday for 15 minutes.
- Track your top three posts each week by engagement rate, not impressions.
- Set a personal benchmark based on your follower tier and update it quarterly.
- Test one content format change per week and record the result.
- Use saves and comment length as your primary quality signals.
Content format affects which metrics you hit. Carousels and documents drive saves and dwell time. Text-only posts with a strong hook drive comments. Video drives watch time and profile visits. Mixing formats across your weekly posts spreads your reach across different audience behaviors.
Pro Tip: Reply to every comment within the first 60 minutes of posting. Early comment activity signals to LinkedIn's algorithm that your post is generating conversation, which triggers broader distribution. Tools like Echoza help you draft replies that match your voice without spending hours at your keyboard.
Common pitfalls in measuring LinkedIn success and how to avoid them
Overemphasis on impressions is the most common mistake. Focusing solely on raw impression counts misses the real ROI, which lives in lead generation and direct conversations with prospects. A post with 500 impressions and 20 comments beats a post with 5,000 impressions and 10 likes. Train yourself to open your analytics and look at engagement rate first, impressions last.
- Ignoring comment quality. Counting comments without reading them misses the signal. Five detailed replies from decision-makers outweigh 50 emoji responses from outside your industry.
- Skipping goal alignment. Without tying posts to clear business outcomes, your analytics are noise. Define whether your goal is lead generation, job opportunities, or thought leadership before you interpret any number.
- Reacting to short-term swings. A single post underperforming does not indicate a strategy failure. Evaluate your four-week rolling average, not individual post results.
- Mixing company page and personal profile benchmarks. Company pages consistently generate lower engagement rates than personal profiles. Applying personal profile benchmarks to a company page will make your page look worse than it is.
- Skipping systematic testing. Changing your posting time, topic, and format in the same week makes it impossible to know what worked. One change per week, measured over at least four posts, gives you reliable data.
The gap between personal profiles and company pages is wider than most users expect. Personal profiles benefit from LinkedIn's preference for person-to-person interaction. If your company page engagement rate is 0.5% and your personal profile sits at 2.8%, that is not a failure. It is the platform behaving as designed. Use your personal profile for relationship-building and your company page for brand-level content.
Key Takeaways
Tracking the right LinkedIn engagement metrics, specifically engagement rate, comment quality, saves, and dwell time, produces better professional outcomes than chasing impression counts.
| Point | Details |
|---|---|
| Engagement rate benchmark | Aim for 2.5% or above; accounts with 1,000–5,000 followers average 2.68%. |
| Comments beat likes | Comments carry 15 times more algorithmic weight than likes on LinkedIn. |
| Saves signal utility | Image posts generate 65.3% of saves; use visuals with frameworks or checklists. |
| Weekly review routine | Spend 15 minutes every week comparing top and bottom posts to find patterns. |
| Test one variable at a time | Change only one element per week to get reliable, repeatable results. |
What I've learned from treating LinkedIn metrics as decision tools
Most people treat their LinkedIn analytics like a scoreboard. They check impressions after posting, feel good or bad about the number, and move on. That habit produces no learning and no improvement.
The shift that changed my approach was treating every metric as a question, not a verdict. A low save rate does not mean the post failed. It means the content was interesting but not useful enough to revisit. That distinction tells me exactly what to write next. A high comment rate on a text post tells me my audience responds to opinions, not just information. I write more opinion posts. The data becomes a content brief.
The other thing I stopped doing was comparing my numbers to accounts ten times my size. Engagement rate scales inversely with follower count. A 2.8% rate on a 4,000-follower account is genuinely strong. Measuring against a 500,000-follower account is like comparing a neighborhood restaurant's foot traffic to a stadium. The metric is the same. The context is completely different.
The discipline that matters most is the weekly review. Fifteen minutes, same time every week, same questions: What beat my benchmark? What missed it? What was different? Over three months, that habit compounds into a clear picture of what your specific audience responds to. No viral moment required. Just consistent, small adjustments based on what the numbers actually say.
— Nicolas
How Echoza turns comment engagement into client conversations
Comment engagement is where LinkedIn growth actually happens, and it is also where most users lose momentum. Writing thoughtful replies to every relevant post in your niche takes time you often do not have.
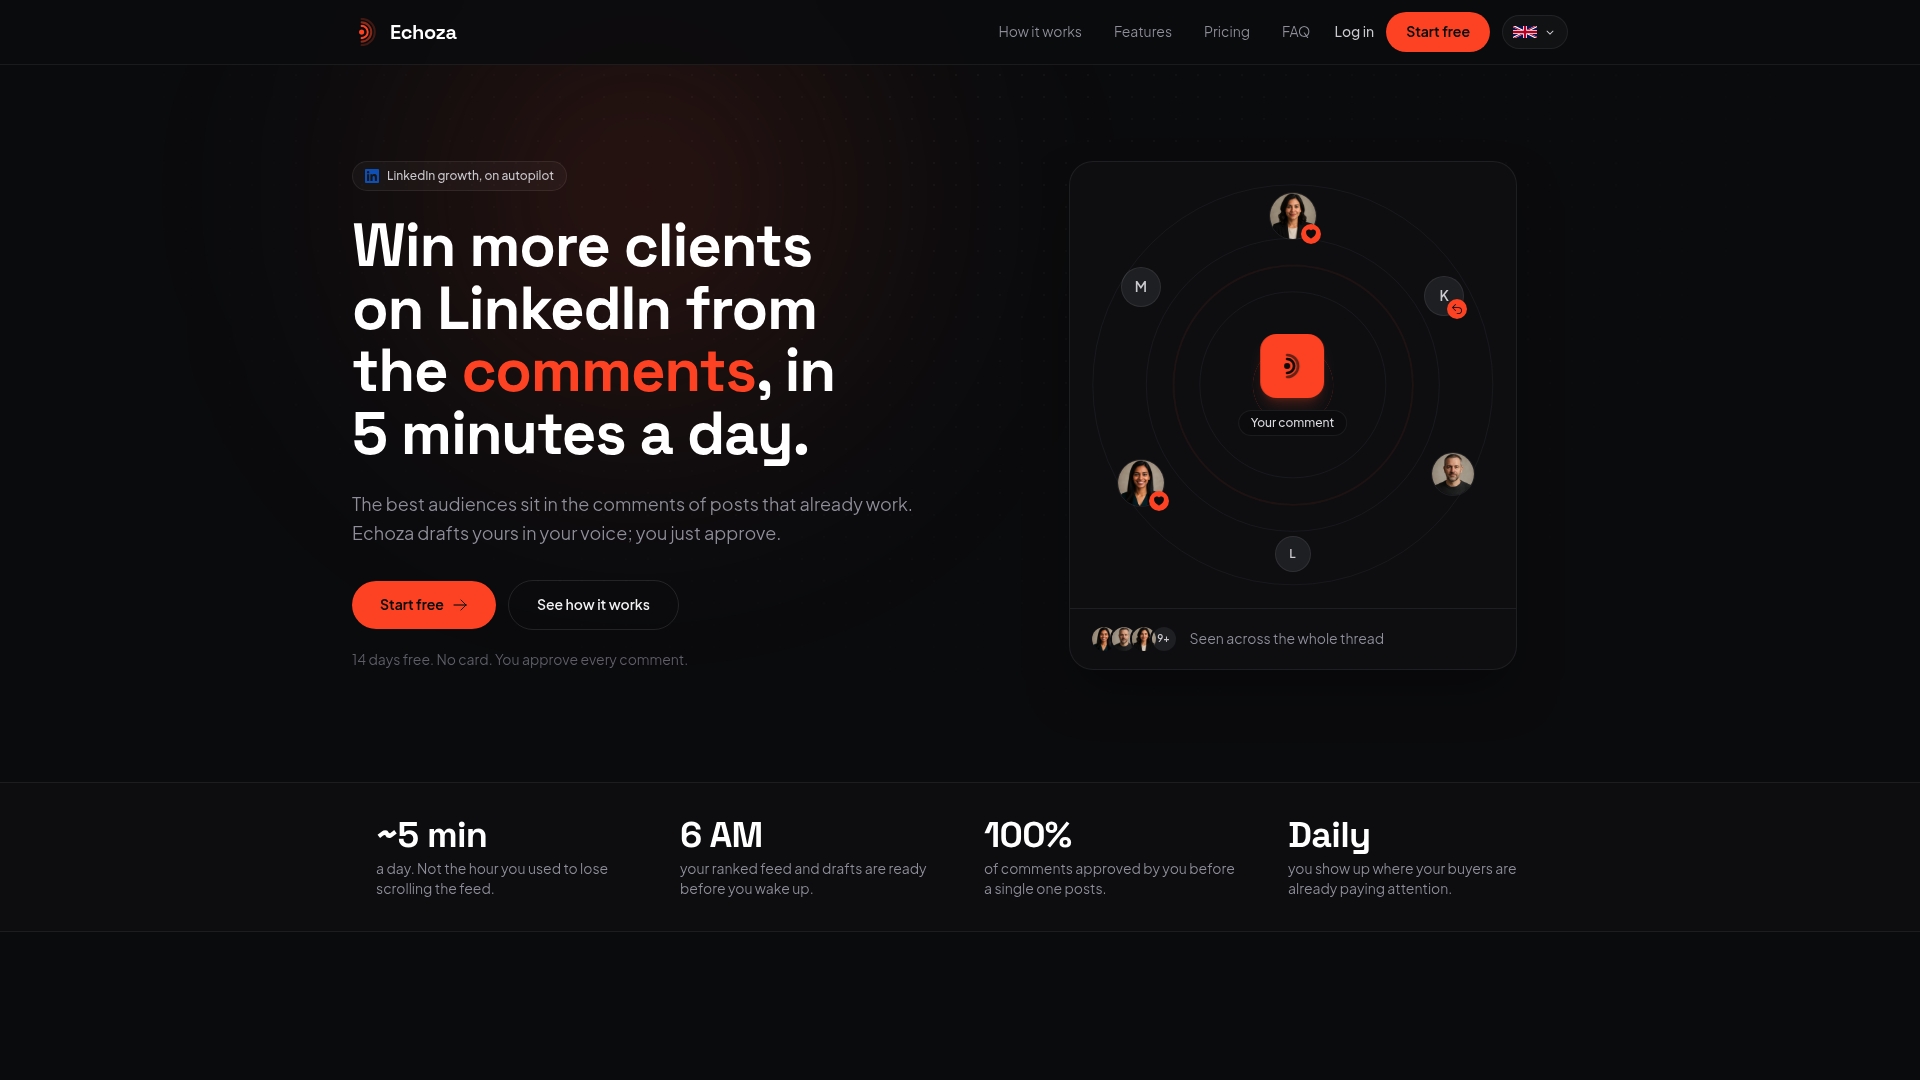
Echoza drafts comments in your voice and places you inside high-reach conversations where your audience is already active. Instead of waiting for your posts to gain traction, you show up consistently in discussions that matter. Users report more profile views and direct client outreach as a direct result. Echoza reviews every comment before it goes live, so your tone and intent stay intact. If you want to turn your LinkedIn engagement into a real pipeline, Echoza is built for exactly that.
FAQ
What is a good LinkedIn engagement rate?
A good LinkedIn engagement rate is 2.5% or above. Accounts with 1,000–5,000 followers average 2.68%, which is the strongest tier across all follower sizes.
Why do comments matter more than likes on LinkedIn?
Comments carry approximately 15 times more algorithmic weight than likes. Long comments over 15 words are twice as impactful as short reactions for boosting a post's distribution.
How do I calculate my LinkedIn engagement rate?
Add your reactions, comments, reposts, and clicks, then divide by impressions, and multiply by 100. This gives you your engagement rate as a percentage.
What are vanity metrics on LinkedIn?
Vanity metrics are raw impression counts and total follower numbers viewed without context. They look impressive but do not indicate whether your content is generating leads, conversations, or professional opportunities.
How often should I review my LinkedIn analytics?
A 15-minute weekly review is the recommended frequency. Focus on your top and bottom performing posts, identify one variable that differed, and test a single change in the following week.