

LinkedIn click-through rate (CTR) is defined as the percentage of people who see your content and then click it, calculated as (total clicks ÷ total impressions) × 100. It is the clearest signal of whether your message actually connects with your audience. A post that earns 500 impressions and 3 clicks has a 0.6% CTR. That single number tells you more about audience fit than likes or follower counts ever will. For freelancers and marketers on LinkedIn, understanding CTR is the first step toward spending less time posting and getting more results from every piece of content you create.
What is a good LinkedIn click-through rate by ad format?
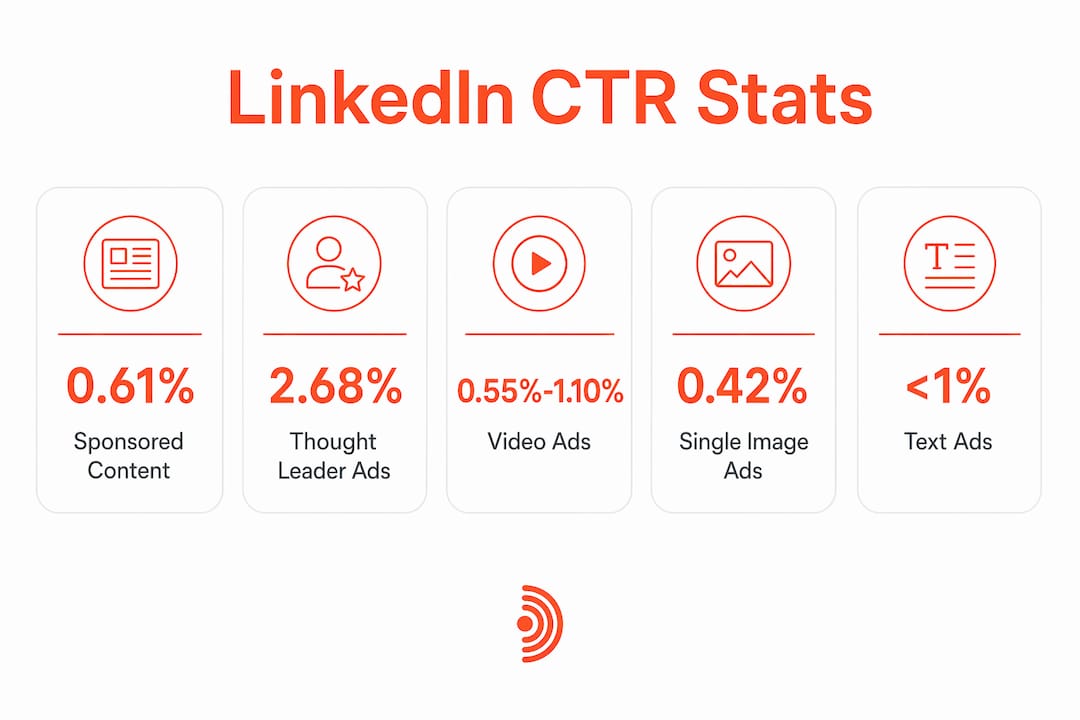
The cross-industry CTR benchmark for LinkedIn Sponsored Content sits at 0.61% in 2026, with most campaigns landing between 0.35% and 0.65%. That range is lower than most other digital ad platforms, and the reason is straightforward. LinkedIn users are browsing a professional feed, not actively searching for solutions. They are in discovery mode, not buying mode.
CTR also shifts significantly by ad format. Here is how the major formats compare:
| Ad format | Typical CTR range |
|---|---|
| Thought Leader Ads | 2.68% median |
| Video Ads | 0.55%–1.10% |
| Carousel Ads | 0.50%–0.95% |
| Single Image Ads | 0.40%–0.50% |
| Text Ads | 0.02%–0.08% |

Thought Leader Ads stand out sharply. They achieve a median CTR of 2.68% compared to 0.42% for single image ads. The reason is that they look like organic posts from real people, not ads. LinkedIn users are trained to scroll past obvious advertising, so content that feels personal and authentic earns far more clicks.
Text Ads sit at the bottom of the table for a structural reason. They appear in a sidebar that most users ignore. Their low CTR is not a failure of messaging. It reflects placement, not quality.
How is LinkedIn CTR calculated and what does it reveal?
The CTR formula is simple: divide total clicks by total impressions, then multiply by 100. What it reveals is more nuanced. A high CTR means your headline, image, and first line of copy created enough curiosity or urgency that someone stopped scrolling and acted. That is a strong signal of audience-message fit.
CTR also feeds directly into LinkedIn's internal Quality Score. High-quality creative can boost CTR 50–100% over generic messaging. LinkedIn rewards that performance by lowering your cost per click and increasing how often your ad gets shown. The relationship runs in both directions. Better creative earns a higher CTR, which earns better delivery, which earns more impressions at lower cost.
CTR is not just an advertising metric. On organic posts, it reflects how well your hook and format match what your audience wants to read. A post with a strong opening line and a clear reason to click the "see more" button will consistently outperform one that buries the point.
Pro Tip: Track CTR alongside dwell time. A high CTR paired with short dwell time tells you the hook worked but the content disappointed. Fix the body, not the headline.
What proven strategies improve LinkedIn click-through rates?
Improving your CTR on LinkedIn comes down to creative quality, timing, and testing discipline. These are the strategies that consistently move the number:
- Use human faces in images. Ads featuring human faces see up to 38% higher engagement than those without. People respond to people. A photo of a real person outperforms a stock graphic almost every time.
- Write specific, value-driven headlines. Vague headlines like "Grow your business" earn low CTR. Specific ones like "How we closed 12 clients in 30 days without cold outreach" earn clicks because they promise a concrete outcome.
- Produce short videos with captions. Thirty-second videos optimized for silent viewing perform well because most LinkedIn users watch without sound. Captions make the message accessible and keep viewers watching longer.
- Add a clear call to action. "Download the guide," "Read the case study," and "Book a call" all outperform vague CTAs like "Learn more." Tell people exactly what happens when they click.
- Post during peak activity windows. Tuesday through Thursday mornings, roughly 8:00 AM to 10:00 AM in your audience's time zone, consistently deliver higher visibility and engagement.
- Use relevant hashtags. Two to five targeted hashtags extend your post's reach to users following those topics, increasing the pool of people who see and potentially click your content.
- A/B test one variable at a time. Change only the headline, or only the image, never both at once. Run each test for at least 5–7 days before drawing conclusions.
Human-centric, narrative posts regularly achieve CTRs of 1.5% to 3% or higher, while direct sales pitches fall below 1%. The data is consistent. Storytelling outperforms advertising on LinkedIn.
Pro Tip: Avoid curiosity-gap hooks that mislead. If your headline promises something your content does not deliver, users click and immediately leave. LinkedIn's algorithm reads that bounce-back behavior as a negative signal and reduces your reach.
What common misconceptions about LinkedIn CTR should you avoid?
The biggest misconception is that a higher CTR is always better. It is not. A 3% CTR from the wrong audience generates zero pipeline. A 0.5% CTR from decision-makers in your exact target industry can generate significant revenue. Pipeline generation quality is a better campaign success metric than raw CTR, especially on LinkedIn where users are browsing rather than searching.
Comparing CTR across ad formats is another common mistake. Carousel ads count every swipe as a click, which inflates their CTR relative to single-image ads where one click equals one action. Benchmarking a carousel campaign against a single-image campaign using CTR alone produces a misleading conclusion. Engagement rate is a more reliable cross-format comparison.
Many marketers also over-focus on CTR while ignoring saves and comments. LinkedIn's algorithm rewards saves and comments more heavily than likes and immediate clicks. A post with 10 saves and 15 comments will often reach more people over time than a post with a higher CTR but no saves. Chasing clicks at the expense of conversation is a losing strategy.
Finally, do not end A/B tests too early. LinkedIn posts gain delayed engagement over several days. Cutting a test short before 5–7 days means you are reading incomplete data. Early results frequently reverse once the full distribution cycle completes.
How can you measure and analyze LinkedIn CTR effectively?
Accurate measurement starts with the right tools and the right questions. Here is a structured approach:
- Open LinkedIn Campaign Manager. For paid content, Campaign Manager shows CTR broken down by ad, audience segment, and date range. Filter by format to avoid mixing carousel and single-image data in the same view.
- Check LinkedIn Analytics for organic posts. The analytics tab on your profile or company page shows impressions, clicks, and engagement rate for each post. Export the data monthly to spot trends.
- Segment by audience demographics. LinkedIn lets you filter performance by job title, industry, seniority, and geography. A 0.4% CTR from senior directors is worth more than a 1.2% CTR from students if your product targets executives.
- Pair CTR with engagement rate. Engagement rate includes reactions, comments, shares, and clicks as a percentage of impressions. It gives a fuller picture of how content performs than CTR alone.
- Track saves separately. Saves do not appear prominently in standard dashboards, but they signal that someone found your content valuable enough to return to. High saves predict extended algorithmic reach.
- Run structured A/B tests. Change one variable per test, run it for at least 5–7 days, and document results in a simple spreadsheet. Over time, patterns emerge that tell you exactly what your audience responds to.
Testing only one variable at a time and allowing full distribution time is the single most important discipline in reliable CTR improvement. Without it, you are guessing.
Key Takeaways
LinkedIn CTR measures audience-message fit, and improving it requires combining creative quality, format selection, and disciplined testing over time.
| Point | Details |
|---|---|
| Know your format benchmarks | Sponsored Content averages 0.61% CTR; Thought Leader Ads reach a 2.68% median. |
| CTR feeds Quality Score | Higher CTR lowers your cost per click and increases ad delivery frequency. |
| Human content wins | Narrative, face-forward posts achieve 1.5%–3%+ CTR versus under 1% for sales pitches. |
| Don't compare across formats | Carousel swipes count as clicks, making cross-format CTR comparisons misleading. |
| Test for at least 5–7 days | LinkedIn's delayed engagement cycle means early test data is often incomplete and unreliable. |
Why I think most LinkedIn marketers are measuring the wrong thing
I have reviewed dozens of LinkedIn campaigns where the marketer was proud of a 1.8% CTR and confused about why the pipeline was empty. CTR is a useful signal, but it is not the destination. The destination is a conversation with someone who can buy from you.
The campaigns I have seen perform best over time share one trait. They treat LinkedIn like a trust-building channel, not a direct-response channel. They post stories about real client problems, real failures, and real results. They earn comments and saves, not just clicks. And they measure success by the quality of the conversations those posts generate, not the percentage of people who clicked.
The other thing I have noticed is that most people test too fast. They run an ad for two days, see a low CTR, and kill it. LinkedIn's algorithm needs time to find the right audience for your content. A post that looks weak on day two can look strong on day seven once the saves and shares have compounded. Patience is a genuine competitive advantage on this platform.
My honest recommendation: track CTR as a diagnostic tool, not a goal. Use it to identify which creative elements are working. Then measure success by lead quality, booked calls, and revenue. Those numbers tell you whether your LinkedIn presence is actually building your business.
— Nicolas
How Echoza helps you turn LinkedIn engagement into clients
Improving your CTR gets people to your profile. What happens next determines whether they become clients. Echoza is built for that next step. It drafts comments in your voice and places them inside high-reach LinkedIn discussions where your ideal clients are already active. Instead of waiting for people to find your posts, you show up where the conversation is already happening.
Echoza users report more profile views and direct client outreach after using the tool consistently. Every comment it drafts matches your tone and goes live only after you approve it. If you want to win clients through comments without spending hours writing them, Echoza is worth a close look.
FAQ
What is a good CTR on LinkedIn?
A CTR of 0.61% is the cross-industry benchmark for LinkedIn Sponsored Content in 2026. Thought Leader Ads regularly exceed 2%, while Text Ads typically fall below 0.08%.
How do I calculate my LinkedIn CTR?
Divide your total clicks by your total impressions, then multiply by 100. LinkedIn Campaign Manager and the Analytics tab on your profile both calculate this automatically.
Why is my LinkedIn CTR low?
Low CTR usually signals a weak hook, a mismatched audience, or an ad format with inherently low click rates like Text Ads. Test your headline and lead image first, since those two elements drive the majority of click decisions.
Does a high CTR always mean better ad performance?
No. A high CTR from the wrong audience produces no pipeline. Prioritize CTR from your target audience segments, and measure lead quality alongside click volume.
How long should I run a LinkedIn A/B test?
Run each test for at least 5–7 days. LinkedIn posts receive delayed engagement from saves and comments that can significantly change your CTR data after the first 48 hours.