

What is LinkedIn engagement rate?
Your LinkedIn engagement rate is the percentage of people who saw your content and actually did something with it. Liked it, commented, shared it, clicked through. It's the ratio of total interactions to total impressions, expressed as a percentage, and it's the number LinkedIn's algorithm watches most closely when deciding whether to push your post to a wider audience.
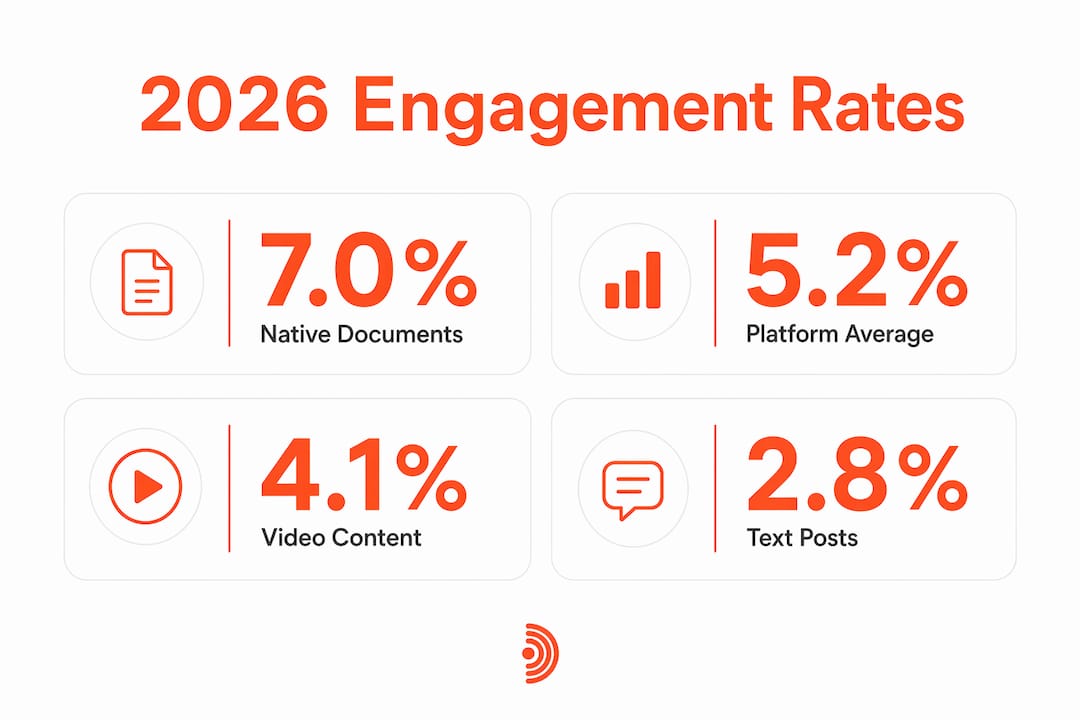
The platform-wide average sits at 5.2% across business content in 2026, up roughly 8% year over year. Personal profiles average about 3.85%, which is higher than company pages that tend to have lower engagement. That gap has widened since 2023 and shows no sign of closing.
Every interaction type below counts toward your total engagement figure:
- Reactions (likes, celebrates, supports, insightful, funny, love)
- Comments (the highest-weight signal in the algorithm)
- Shares and reposts
- Post clicks (clicking to expand "see more," clicking a link, clicking a photo)
- Follows triggered by a post
- Saves (included in some dashboard calculations, not all)
How to calculate your LinkedIn engagement rate
The industry-standard formula is straightforward:
(Total Engagements ÷ Total Impressions) × 100
- Open LinkedIn Analytics for the post you want to measure.
- Note the total impressions (how many times the post appeared in a feed).
- Add up all reactions, comments, shares, and clicks.
- Divide that sum by impressions.
- Multiply by 100 to get your percentage.
Pro Tip: Use the impression-based formula, not the follower-based one. If you have 500 followers but LinkedIn only showed your post to 200 people, dividing by 500 understates your actual performance. Dividing by 200 gives you the real number.
A quick example: 85 total engagements on a post that received 1,400 impressions gives you (85 ÷ 1,400) × 100 = 6.07%. That clears the "good" threshold for a personal profile.
One important caveat: different LinkedIn analytics dashboards count slightly different things. The per-post view may include clicks that the company page summary omits. Pick one method and stick with it so your trend data stays comparable over time.
| Metric | What it includes |
|---|---|
| Total engagements | Reactions, comments, shares, clicks, follows, sometimes saves |
| Total impressions | Every time the post appeared in a feed, including repeat views |
| Engagement rate | (Engagements ÷ Impressions) × 100 |
LinkedIn engagement rate benchmarks for 2026
The 5.2% platform average covers a wide range of account types and content formats. Knowing where you sit within that range matters more than the headline number.
For personal profiles, 4%–6% is considered good and 6%+ is excellent. Company pages run lower: 2%–3% is a healthy range for a brand page. Anything above 10% is exceptional, reached by roughly the top 4% of posts.
Engagement rate naturally declines as follower count grows. Accounts with a very large follower base generally see lower engagement rates, which remain healthy relative to their scale. A 100K-follower account at 1.5% is doing fine. A 1,000-follower account at 1.5% has a real problem.
Content format is the other major variable. Native documents (carousels) lead the platform at 7.0% average engagement, followed by multi-image posts at 6.45% and video at 6.0%. Text-only posts sit at 4.5%, and link posts trail at 3.25%.
| Content format | Relative engagement rates |
|---|---|
| Native document (carousel) | Highest engagement among formats |
| Multi-image | High engagement |
| Video | Above average engagement |
| Image | Moderate engagement |
| Text only | Lower engagement |
| Poll | Relatively low engagement |
| External link | Lowest engagement among formats |

The format hierarchy reflects a simple truth: content that makes someone pause and interact (swipe a carousel, watch a video, click through multiple images) earns more engagement than content they can absorb in two seconds and scroll past.
Five strategies that actually move your engagement rate
Most engagement problems trace back to one of three root causes: wrong audience, wrong content, or wrong format. The six levers below address all three, and applying them consistently produces compounding results over 3–6 months.
- Sharpen your hook. LinkedIn collapses every post after the first 2–3 lines. If those lines don't pull the reader in, the rest of the post never gets read. Spending five extra minutes on the opening lines alone can lift engagement rates 30%–60% within four weeks.
- Use specific CTAs. Posts that end with a direct question earn 2–3x more comments than posts that end with a statement. Comments carry roughly 5–10x the algorithmic weight of a like, so this single change has an outsized effect on distribution.
- Engage in the first hour. LinkedIn's algorithm decides a post's fate in the first 60–90 minutes based on early engagement velocity. Authors who actively respond to comments in that window earn 50%–100% more total engagement than those who post and walk away.
- Distribute personally. Send the post directly to a handful of relevant connections before the algorithm warms up. That initial velocity triggers wider distribution, and the lift from personal distribution alone is typically 2–5x.
- Mix content formats. Rotating between carousels, video, text, and multi-image posts keeps your feed from going stale and lets you capture the format-specific engagement boosts shown in the benchmark table above.
- Post consistently. Posting 3–5 times per week outperforms bursts of 10 posts followed by silence. The algorithm rewards accounts that show up reliably. For most B2B professionals, 3–4 substantive posts per week sustained for 12+ months is the cadence that compounds.
Pro Tip: Consistency beats occasional viral spikes for sustained algorithmic benefit. One post that hits 15% engagement followed by two weeks of silence does less for your reach than steady 5% performance across 20 posts.
For a deeper breakdown of tactics specific to 2026, the LinkedIn engagement guide on Echoza's blog covers format-by-format approaches worth bookmarking.
How Echoza helps you grow engagement through comments
Most engagement advice focuses entirely on your own posts. That's only half the picture. Personalized comments in high-reach discussions can increase your exposure more efficiently than creating more original content, because you're placing yourself in front of audiences that are already engaged and paying attention.

Echoza is an AI-powered commenting tool built specifically for LinkedIn. It analyzes your past activity and writing style, then drafts comments in your voice for posts where your target audience is already active. You review and approve every comment before it goes out. Nothing posts without your sign-off.
Key features that set it apart from generic automation:
- Voice profiles: Echoza learns your tone, vocabulary, and communication style so comments read like you wrote them, not a bot.
- Multi-account management: Agencies and teams can manage multiple LinkedIn profiles from one dashboard, each with its own voice profile.
- Scheduling and activity caps: Approved comments are distributed across working hours at a natural pace, avoiding the patterns that trigger LinkedIn's spam detection.
- Feed ranking: Echoza surfaces the posts most worth commenting on, based on relevance to your audience and the post's reach potential.
Echoza users report increased profile views and client outreach after using the tool consistently, confirming that strategic commenting drives meaningful engagement and lead generation beyond what post-only strategies achieve.
The approval workflow is what separates Echoza from blunt automation tools. You stay in control of every word that goes out under your name, which means the engagement you generate is genuine, not manufactured. That distinction matters to LinkedIn's algorithm and to the people reading your comments.
For B2B professionals who want to grow their LinkedIn presence without spending hours on manual outreach, Echoza's commenting approach fills a gap that post-creation tools leave wide open.
Real-world examples of LinkedIn engagement improvements
The pattern that shows up repeatedly among professionals who improve their engagement rate is not a single viral post. It's a structural change in how they show up on the platform.
A B2B consultant with 3,200 followers shifted from posting text-only updates to a mix of native document carousels and short video clips. Within eight weeks, their average post engagement climbed from roughly 2.1% to 5.4%, crossing the "good" threshold for their follower range. The format change did most of the work before any other variable changed.
A marketing agency managing a company page with 12,000 followers was stuck below 1% engagement. The fix was not more content. It was better hooks and a deliberate first-hour engagement routine where the page admin responded to every early comment within 30 minutes of posting. Over three months, the page's average engagement rate moved to 2.3%, which cleared the healthy benchmark for a company page at that follower size.
The third pattern involves commenting strategy. Professionals who began leaving substantive comments on high-reach posts in their niche, rather than relying solely on their own content, saw profile view increases within two to three weeks. The engagement signals from active commenting feed back into how LinkedIn's algorithm treats your own posts, creating a reinforcing loop that post-only strategies miss entirely.
Key Takeaways
The most reliable path to a higher LinkedIn engagement rate combines impression-based measurement, format selection, consistent posting cadence, and active participation in relevant discussions.
| Point | Details |
|---|---|
| Platform average in 2026 | LinkedIn's overall engagement rate averages 5.2%, with personal profiles at 3.85%. |
| Best-performing format | Native document carousels lead all formats at 7.0% average engagement rate. |
| Follower size affects rate | Accounts above 50,000 followers typically see rates around 1.66%, which is normal at scale. |
| First hour is critical | Strong early engagement in the first 60–90 minutes can expand a post's reach by 10–100x. |
| Comments beat likes | Comments carry roughly 5–10x the algorithmic weight of a reaction in LinkedIn's distribution model. |
Try Echoza to grow your LinkedIn presence
If you want to grow your LinkedIn engagement without spending more time creating posts, Echoza gives you a second lever most professionals never use. By placing you inside high-reach conversations with comments that sound exactly like you, it builds visibility where your audience is already paying attention.
Start your free trial and see how strategic commenting changes your profile view numbers within the first two weeks.